

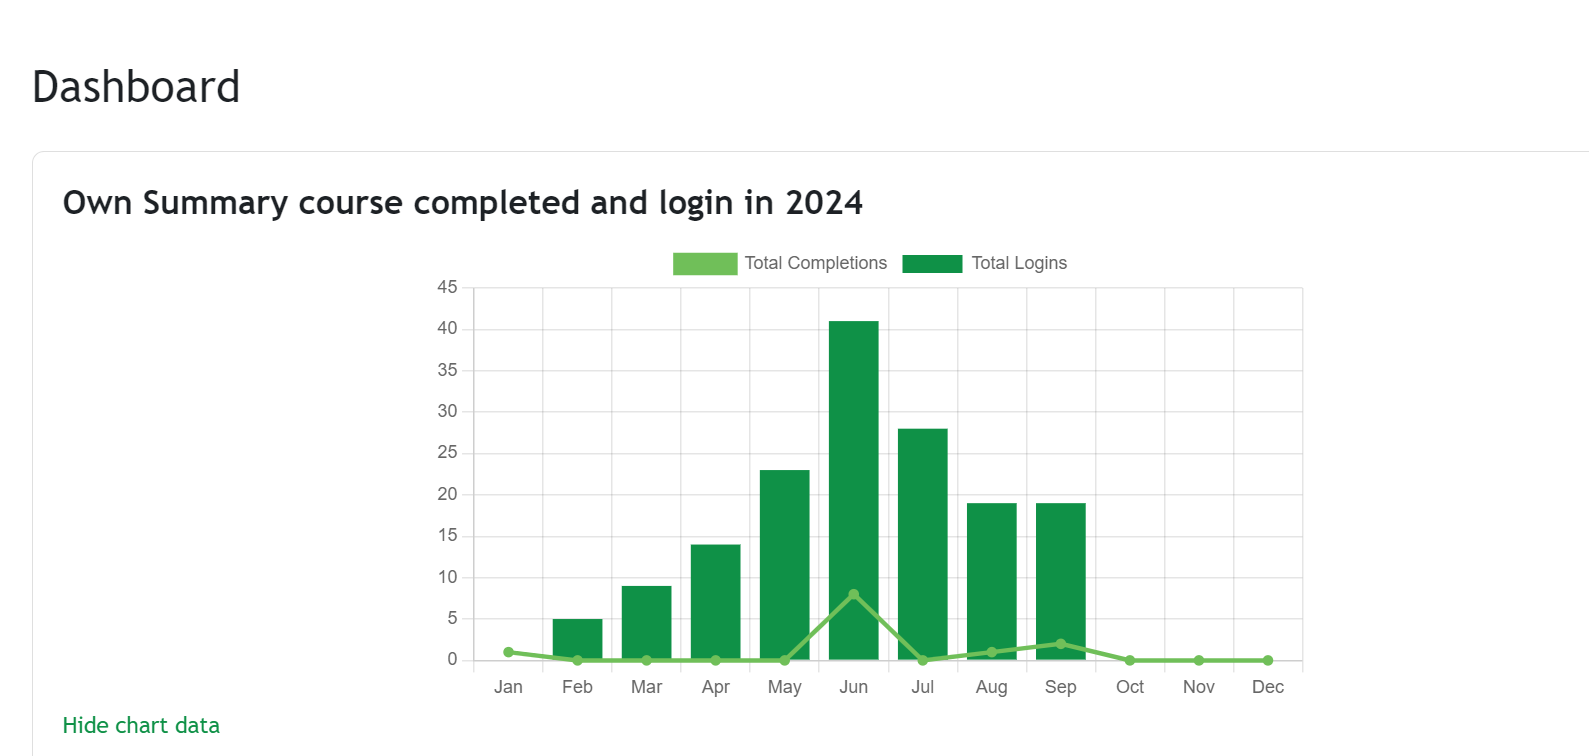
To add the total course completed and login chart in the current year to the dashboard, you need to get a query from course complete and login from the database.
We created 2 series in the same chart, one is a bar chart (stand by total login) and another is a series type line (stand by total course completed), and both data are displayed by month.
$cyear = date(“Y”); is getting current year.
$userId = $USER->id; is getting user ID or student ID.
 // Set labels for months
          $chart->set_labels([
                        'Jan',
                        'Feb',
                        'Mar',
                        'Apr',
                        'May',
                        'Jun',
                        'Jul',
                        'Aug',
                        'Sep',
                        'Oct',
                        'Nov',
                        'Dec'
                    ]);
open your code and go to Moodle->My-> index.php
Follow and add code as below:
<?php
global $PAGE, $USER, $DB, $cyear;
$cyear = date("Y");
$userId = $USER->id;
<h4 class="card-title">Own Summary course completed and login in <?php echo $cyear ?></h4>
<div style="overflow-x:auto;">
<?php
global $DB;
// Query for course completions
$completions_sql = "SELECT
MONTH(FROM_UNIXTIME(cp.timecompleted)) AS month,
COUNT(c.id) AS total_completions
FROM
{course_completions} cp
JOIN {course} c ON
cp.course = c.id
JOIN {user} u ON
cp.userid = u.id
WHERE
u.id = $userId and
YEAR(FROM_UNIXTIME(cp.timecompleted)) = $cyear
GROUP BY
month";
$completions_data = $DB->get_records_sql($completions_sql);
// Query for logins
$logins_sql = "SELECT
MONTH(FROM_UNIXTIME(l.timecreated)) AS month,
COUNT(l.userid) AS total_logins
FROM
{logstore_standard_log} l
WHERE
l.action = 'loggedin' AND l.userid = $userId AND YEAR(FROM_UNIXTIME(l.timecreated)) = $cyear
GROUP BY month";
$logins_data = $DB->get_records_sql($logins_sql);
// Prepare months and series data for the chart
$months = range(1, 12); // 12 months
$completions_series = [];
$logins_series = [];
// Loop through months to populate data
foreach ($months as $month) {
$completions_series[] = isset($completions_data[$month]) ? $completions_data[$month]->total_completions : 0;
$logins_series[] = isset($logins_data[$month]) ? $logins_data[$month]->total_logins : 0;
}
// Add series to the chart
$chart = new \core\chart_bar();
$s1 = new \core\chart_series('Total Completions', $completions_series);
$s1->set_type(\core\chart_series::TYPE_LINE);
$chart->add_series($s1);
$s2 = new \core\chart_series('Total Logins', $logins_series);
$chart->add_series($s2);
// Set labels for months
$chart->set_labels([
'Jan',
'Feb',
'Mar',
'Apr',
'May',
'Jun',
'Jul',
'Aug',
'Sep',
'Oct',
'Nov',
'Dec'
]);
// Render the chart
echo $OUTPUT->render($chart);
?>
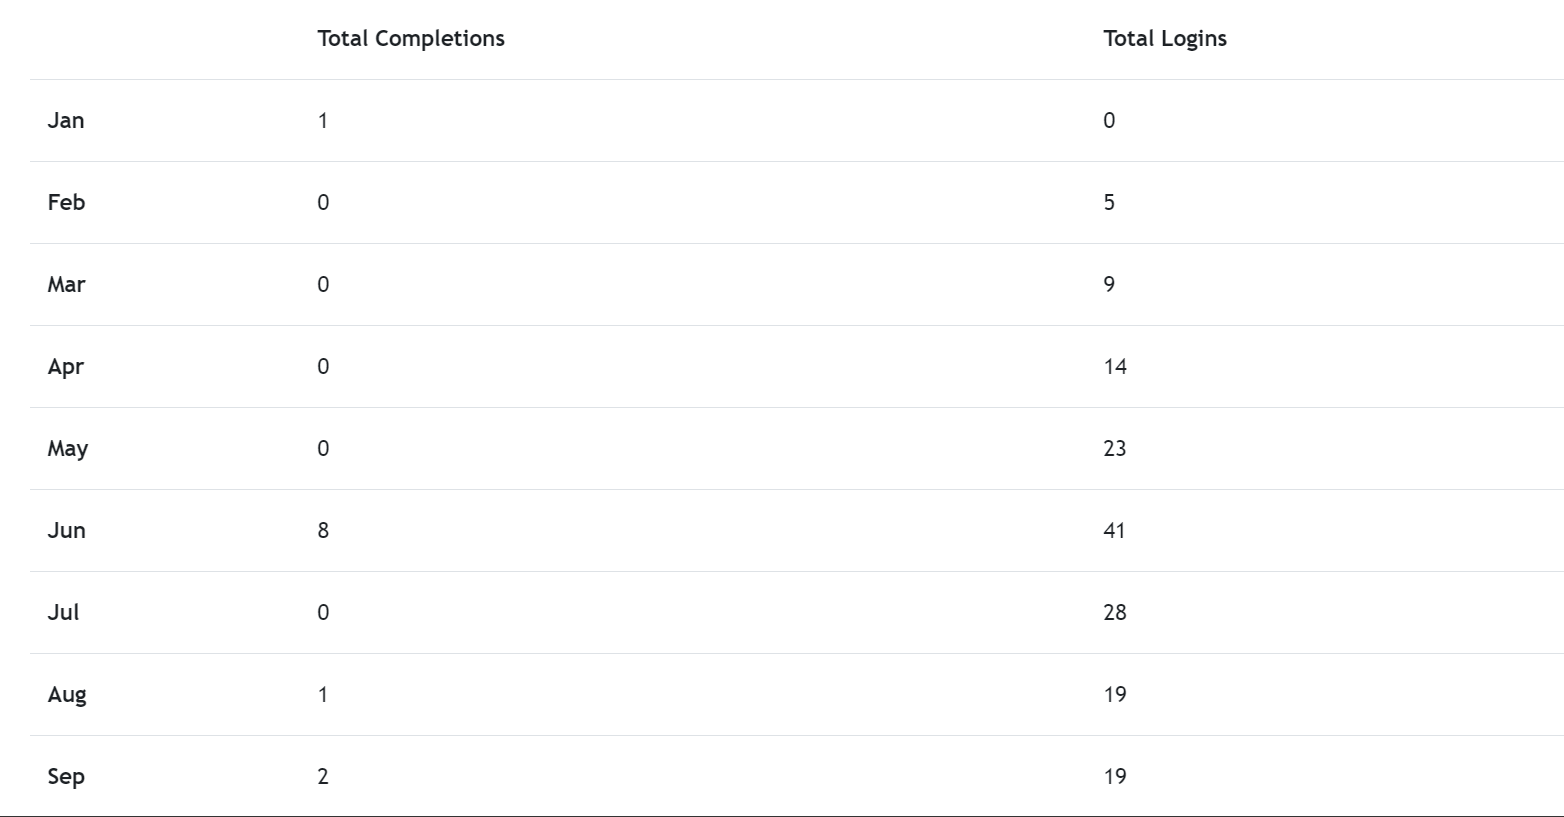
</div>Check the result with the chart below:
Category :
Tags :
Share this Article!